
USask’s Role in the Economy

As noted earlier in the report, the University of Saskatchewan (USask) contributed $2.0 billion to Saskatchewan’s economy in 2024/25, including university operations (teaching, research, and service), new construction, student living expenditures, and visitor spending. To put this number in context, Saskatchewan’s gross domestic product (GDP) is roughly $110 billion,8 meaning that nearly 2% of the provincial economy is tied directly or indirectly to the university. The economic contribution and growth of the university has a positive impact on the health of the Saskatchewan economy.
$2.0B
USask increases Saskatchewan’s GDP by $2.0 Billion
$2.4B
USask increases Canada’s GDP by $2.4 Billion
2.2%
2.2% of all provincial jobs are tied in some way to USask
USask plays an outsized economic role in a province with a relatively small population.
The university directly and indirectly supported 13,320 jobs in Saskatchewan. For every one job at the university, another job is supported elsewhere in the economy. In 2024, there were approximately 609,000 jobs province-wide, which means that 2.2% of all provincial jobs are tied in some way to USask.
FIGURE 2. University of Saskatchewan Total Economic Impact on Saskatchewan, 2024/25
| Impact Category | GDP ($BN) | Labour Income ($BN) | Jobs |
|---|---|---|---|
| University operations | $1.524 | $0.847 | 8,843 |
| New construction | $0.090 | $0.049 | 633 |
| Student living expenditures | $0.296 | $0.148 | 3,121 |
| Visitor spending | $0.060 | $0.034 | 722 |
| Total impacts | $1.970 | $1.078 | 13,320 |
| Saskatchewan | $109.702 | 609,000 | |
| Contribution of USask | 1.8% | 2.2% |
Note: Columns reflect the total economic impact effects for GDP, labour income, and jobs. Total economic impact is the sum of USask direct expenditures and secondary expenditures (indirect and induced) calculated using the Statistics Canada Interprovincial Modelling System.
Nationally, RTI estimates USask’s national GDP impact to be $2.4 billion and 16,368 jobs. National impacts are considerably larger than provincial impacts due to USask’s economic ties and sourcing of goods and services from other provinces in addition to Saskatchewan.
USask has been a cornerstone of Saskatchewan’s higher educational system, society, and economy since its founding in 1907. As a member of the U15 Canada association of leading research universities, USask tackles the most pressing socio-economic, scientific, and environmental challenges facing the province. Research revenue in 2024/25 was $321.1 million.
The impact is evident across multiple industry sectors, such as agriculture, natural resources, and water and food security, where the university’s educational programs, scholarship, and applied research translate into both global scientific contributions affecting human and animal health and the environment and preparation of a skilled workforce and technical solutions that benefit the local economy.
Components Driving Economic Activity
RTI estimates that USask-driven direct spending totaled $1.774 billion in 2024/25. This included:
- university operating expenses (e.g., salaries, goods, services) for pursuing its teaching, research, and service mission,
- university capital investment and construction,
- student living expenditures, and
- visitor expenditures.
Annual operating expenses made up the university’s largest spending category; these included salaries and benefits for 6,647 employees,9 supplies and services, scholarships, and utility costs. Total spending, including for major facilities such as the Canadian Light Source (CLS) and the Sylvia Fedoruk Canadian Centre for Nuclear Innovation, was $1.1 billion in 2024/25.10
FIGURE 3. Breakdown of USask-Driven Direct Spending, 2024/25
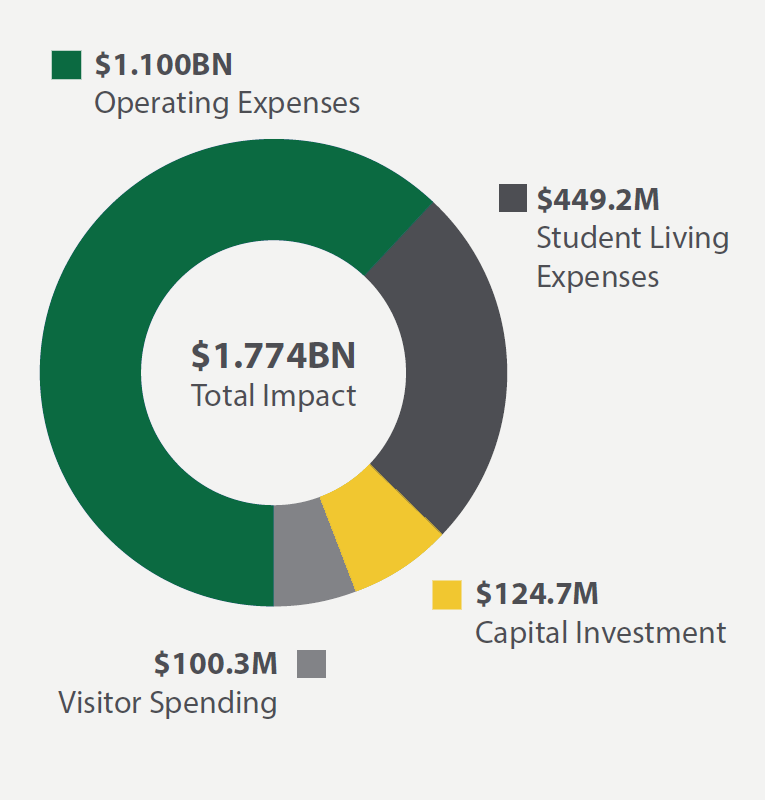
$1.7B+
USask-driven direct spending driving economic activity totaled $1.774 billion in 2024/25
The university engages in a substantial amount of capital investment activity, which amounted to $125 million for the year. This investment included new construction and renovation on campus for medical, laboratory, classroom, and student facilities. Also included in this number are expenditures on advanced instrumentation, equipment, and computing infrastructure that support the university’s mission.

More than 26,600 students were enrolled in 2024/25. The average annual living expenditure for students was $16,860,11 including shelter, food, personal expenses, entertainment, and transportation. Thus, total student spending was estimated to be $449.2 million.
USask draws visitors from across Canada and around the world for conferences, Huskies sporting events, educational and research collaborations, and seeing friends and family. Discover Saskatoon and Destination Canada promote the University of Saskatchewan as a destination for business events, research, and investment in three sectors: agribusiness, the life sciences, and mining. In 2024/25, the total value of this visitor spending was estimated to be $100.3 million.12
Measuring Economic Impact
Economic impact is measured by analyzing all the different economic activities that USask catalyzes. Statistical information can be measured about the relationship between economic activity in one sector with another, the proportion of GDP, jobs, income, and other impact measures that are linked to USask.
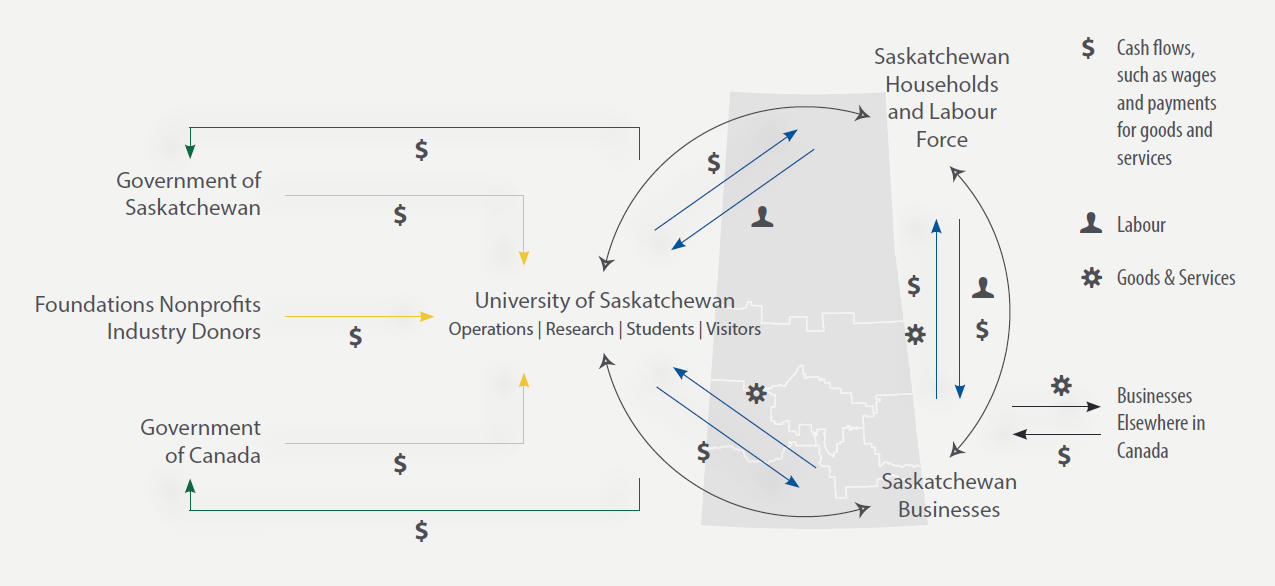
Figure 4 depicts many of the economic interrelationships that USask has within the province. This approach for analyzing the comprehensive spending patterns generated by the university is known as input-output analysis, a well-known and reliable methodology with a long history in economics.13 RTI used the official interprovincial version of the Canadian Input-Output Model developed by Statistics Canada.
FIGURE 4. Ties between the University of Saskatchewan and the Provincial Economy
Fiscal Impact on Saskatchewan
Financial operating results for the fiscal year that ended April 30, 2025, show that the Government of Saskatchewan invested $540.7 million in the university, principally through the annual operating grant. This equated to 40% of USask’s total annual revenue of $1.34 billion.
For every $1 provided by the Government of Saskatchewan, USask brings in $1.48 from other sources. The university uses its provincial support to meet its educational mission, conduct research, and generate leverage that helps capture research funding from federal and non-federal sources. As noted elsewhere in this report, USask’s research revenue has grown substantially in recent years.
33%
One-third of the province’s investment in the university is returned through tax generation.
The economic activity catalyzed by USask generates tax revenues for the province. These include personal income tax ($88.9 million) and taxes on products and production ($76.2 million) for a total of $165.1 million. Comparing the $540.7 million provided to USask by the province to the $165.1 million generated by USask through taxes, the net impact to Saskatchewan’s public finances is $375.6 million. Thus, about one-third of the province’s investment in the university is returned through tax generation.
FIGURE 5. University of Saskatchewan’s Fiscal Impact on the Province, 2024/25
| Revenue | |
|---|---|
| Revenue from Government of Saskatchewan sources ($M) | $540.7 |
| Share of revenue from Government of Saskatchewan sources | 40% |
| For every $1 from Government of Saskatchewan sources, revenue generated by other sources | $1.48 |
| Total Tax Generation | |
| Provincial personal income tax ($M) | $88.9 |
| Provincial taxes on products ($M) | $61.6 |
| Provincial taxes on production ($M) | $14.6 |
| Total taxes (millions) | $165.1 |
| For every $1 from Government of Saskatchewan sources, tax revenue generated | $0.31 |
Spotlight
Loading...
Per Capita Economic Impact in Comparison to Other Universities
As noted, USask contributes $2 billion of GDP to Saskatchewan’s economy. In per capita terms (total economic impact divided by provincial population), USask generates $1,555 of GDP per resident of Saskatchewan. How does this compare to the economic impact of other universities? RTI analyzed available economic impact studies for 9 other universities and found that USask’s GDP per capita impact is among the highest. This indicates that USask plays an outsized economic role in a province with a relatively small population.
FIGURE 6. Per Capita Economic Impact of Universities in Canada
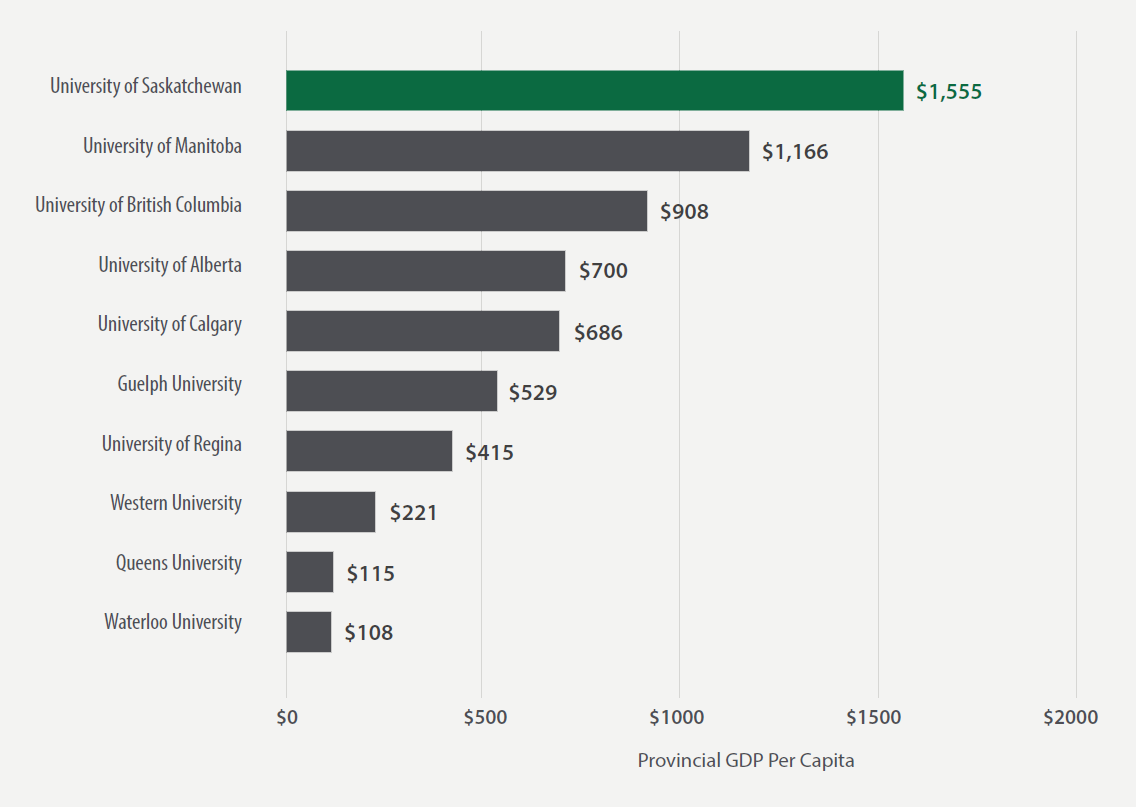
Note: Different methodologies were used to estimate each university’s total economic impact. For consistency, RTI only compared the impact of operating expenditures, capital expenditures, student spending, and visitor spending.
Source: Full list of economic impact studies is in the Appendix.
- Saskatchewan’s GDP at current market prices is approximately $110 billion. Statistics Canada’s primary GDP measure is referred to as “real GDP,” which accounts for year-on-year changes from inflation and other effects. For reference, its real GDP in 2024 was $80.5 billion chained 2017 dollars. We use GDP at market prices here to simplify comparison between USask’s financial data, economic impact results, and Saskatchewan’s economic data.
- University employment includes all full- and part-time employment. The total number of full-time equivalents (FTEs) is 5,557.
- University of Saskatchewan. (2025). Annual financial report 2024/25. Total spending is the total expense line less amortization and decommissioning costs, which are not cash expenditures.
- Ministry of Advanced Education. (2025). Saskatchewan student aid administrative guidelines, 2024/25.
- This is based upon Statistics Canada data that estimate 3.2 million visitors to Saskatoon and $802.8 million in spending in 2024. RTI used a conservative assumption that USask-related events and activities accounted for one-eighth (12.5%) of visitor spending in the Saskatoon region in 2024.
- Because input-output analysis analyzes actual spending patterns, our focus is on annual expenses and not on annual revenues. There are lags between when funds are received and when funds are spent. If the analysis used revenue to estimate university spending, it would overstate economic impacts.